Here is a run through of this weeks observations:
The Basic Model
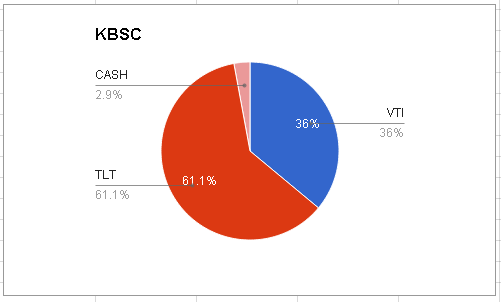
One of my models is a simple allocation program between the total stock market, VTI, and long term government bonds, TLT. These two ETFs are a great pair to follow since they have almost the same average volatility. Thus, they can be compared based on pure relative strength with about equal expectations for each holdings appreciation or depreciation capability.

The current allocation for this program is Conservative (<40% stocks). This week saw a slight shift back towards stocks and a reduction of cash.
It remains to be seen what is in store for US equities in the first half of 2015. We are finally making it back to positive territory for the year, but the risks are still high. It will take more time for markets to digest European QE. Looking at the data, I cannot draw any other conclusion than my holdings are in traditionally defensive areas of the market. Does this mean we are heading for meaningful weakingness in global equities? Remains to be seen. The markets are always churning, and sometimes holdings in uptrends just need a rest.
We need more time for US equities to tip their hand. Meanwhile, there are plenty of other places to have capital that are not in such ambiguous positions.
Keep an Eye on Emerging Markets

Above is a weekly chart of EEM, an ETF that comprises equities from emerging market economies like China, India, Brazil, Taiwan, and South Korea. As you can see, when EEM has broken out on a weekly basis in the past, EEM has tended to be strong for many weeks afterwards. We are in the midst of another break out. It will be a good idea to keep EEM and other ETFs like FXI (China), EPI (India), Brazil (EWZ), etc on your shopping lists as they may continue to perform well in the coming weeks.
Hedging Out Currency Risk
Interested in investing in Europe now that QE is confirmed? Be careful which funds you buy! As a US investor with assets, and, thus, capital, priced in US dollars, you cannot simply purchase foreign assets thinking they will move in the same manner as US stocks. Because foreign assets are priced in their home currencies, their value to a US investor is not only what price they will fetch on the foreign market, but also how their respective currency is changing relative to the US dollar.
Look at the charts below which show EWG, the Germany Fund, and DXGE, the Germany Currency-Hedged Equity Fund for the SAME time period. There is a substantial difference in price appreciation for both holdings:

As the Euro weakens towards the dollar, this makes all assets priced in Euros worth "less" to American investors dealing in US dollars. Both EWG and DXGE have exposure to the German stock market, but only DXGE outperforms when the Euro is weak and EWG outperforms when the Euro is strong.
It is good to do your homework on the financial instruments available and tailor your portfolio to current conditions. Wisdomtree, for instance, has a a lineup of currency-hedged funds, including DXGE (Germany), DXJ (Japan), and HEDJ (Total International). DBEU is a Europe hedged fund if you are looking for a VGK alternative.
Overall
Deflationary assets (bonds, dollar, inverse commodites, gold, defensive stock sectors) continue to lead and black clouds remain over the US stock market. Eurozone easing may be providing a ray of light, however.
Emerging markets may be experiencing a short-term breakout. Check out gold too (not mentioned above)!
See you all next week!
Emerging markets may be experiencing a short-term breakout. Check out gold too (not mentioned above)!
See you all next week!