Tuesday, June 14, 2016

POS Signals Long Position on US Market

According to the internal rules for the Point of Sail Index, a market BUY signal occurred on June, 14th, so a long position will be opened at the market close tomorrow, June, 15th.

This will be the third trade of 2016. Keep in mind, the POS is an automated trading system based on technical indicators and pre-written rules.

For more on the POS Index and the trading system, visit: POS Market Scores History Explained


Saturday, May 28, 2016

POS 2nd Long Signal of 2016 is Successful

The POS signaled to close the LONG trade from May, 20th, selling at the close on May, 27th. The hypothetical results of the trade for trading UPRO are a return of 6.9%. If one traded SPY, the return would be about 2.3%.

This successful trade erased the small loss from the prior trade signal, putting the system into positive territory for the year.


Monday, May 23, 2016

I Caught a Major Error in the Calculation of the Market Heat Index

Hey all,

I apologize for the sudden change in Heat Index today. I was working with the raw data and I realized that the calculations had been malfunctioning since April. I have fixed the problem and now the number is accurate.

This is one of the reasons why I have no trading programs based on the Heat Index right now. Again, I apologize for the mistake, and I expect the indicator to work correctly going forward.

There are no issues with my other indicators such as the POS as it is calculated differently.

Thanks for your patience,

Maintrimmer Cap

Thursday, May 19, 2016

POS Signals Long Position on US Market

As per the internal rules for the Point of Sail Index, a market BUY signal occurred on May, 19th, so a long position will be opened at the market close tomorrow, May 20th.

This will be the second trade of 2016. Keep in mind, the POS is an automated trading system based on technical indicators and pre-written rules.

For more on the POS Index and the trading system, visit: POS Market Scores History Explained


Friday, May 13, 2016

POS Experiences Whipsaw for First Trade in 2016

The POS signaled to close the LONG trade from May, 2nd, selling at the close on May, 12th. The hypothetical results of the trade for trading UPRO are a return of -2.2%. If one traded SPY, the return would be about -0.7%.

Keep in mind that the POS moves similarly to a stochastic momentum indicator, so the strength of recent historical moves greatly effects what sort of price action will produce signals in the future. This feature respects the assumption that current momentum is related to future momentum. This principle can obviously be disagreed with and is not always historically true, but keep in mind that the POS is dependent on such an assumption, as it works well in trending markets.


Sunday, May 1, 2016

POS Signals Long Position on US Market

As per the internal rules for the Point of Sail Index, a market BUY signal occurred on April, 29th, so a long position will be opened at the market close tomorrow, May 2nd.

This will be the first trade of 2016. The POS shuttered itself through the winter.  Keep in mind, the POS is an automated trading system based on technical indicators and pre-written rules.

For more on the POS Index and the trading system, visit: POS Market Scores History Explained


Friday, April 29, 2016

US Economic Health Update for March

With the release of the Real Personal Income data for March, 2016, I have updated my US economy tracking page to reflect the data up to the end of March.


Changes for March:
The BIG 4 has switched from "Expanding Slowly" to "Contracting Slowly." Moreover, the RISK 4 has switched from "Slightly High" to "Slight Low."  

The indicators as a group have continued to show weakness in the rate of change of their respective indicators since Q4 2014. While it is still unclear how deep this current weakness will persist, it is not comforting to see the indicators flirting with their zero lines. Prior times when the indicators have crossed zero have marked significant slow periods. On the other hand, the rate of deterioration of the indicators has not reached the magnitude of the 2008 recession.


For more information, please visit:
http://www.maintrimmercapital.com/p/us-economic-health.html


Monday, March 28, 2016

US Economic Health Update for February

With the release of the Real Personal Income data for February, 2016, I have updated my US economy tracking page to reflect the data up to the end of February.


Changes for February:
The Masterphase has switched from "Improving Slowly" to "Deteriorating Slowly." The index is being pulled negative by the continued high value for the RISK 4 or the measures of financial risk in the US.

For more information, please visit:
http://www.maintrimmercapital.com/p/us-economic-health.html

Friday, February 26, 2016

US Economic Health Page Updated for January

With the release of the Real Personal Income data for January, 2016, I have updated my US economy tracking page to reflect the data up to the end of January.


You will notice I have added qualifiers to the summary.  I compare the current values to historical results to make these distinctions.  For the Big 4, the possibilities are either "Expanding" or "Contracting" at the rate of slowly, moderately, or quickly. For the Risk 4, the possibilities are either "High" or "Low" and can be designated slightly, moderately, or extremely. Finally, the MasterPhase possibilities are "Improving" or "Deteriorating" at the rate of slowly, moderately, or quickly.

For more information, please visit:
http://www.maintrimmercapital.com/p/us-economic-health.html

Sunday, February 21, 2016

US Financial Risk 4 Index Indicates High Financial Risk in January

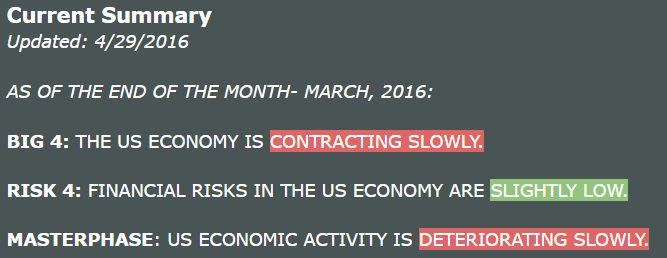
As of the end of January, The average of the "Risk 4," a measure of four of the FRED's risk tracking indexes, has crossed above zero, indicating a high risk of financial crisis in the US economy.  The RISK 4 are the St. Louis Fed Financial Stress Index (STLFSI), Kansas City Fed Financial Stress Index (KCFSI), Chicago Fed National Financial Conditions Index (NFCI), and the Cleveland Financial Stress Index (CFSI).


The last three times this crossover occurred were August 2007, May 2010, and August 2011. We know that both 2010 and 2011 featured large corrections in the market, but, ultimately, were in the course of a long term bull market. However, the 2007 event preceded the major US financial crisis.

For more information, visit my US Economic Health page: http://www.maintrimmercapital.com/p/us-economic-health.html


Thursday, January 7, 2016

Markets Very Oversold- POS Stays on the Sidelines Due to Uncertain LT Trend

There are very oversold readings occurring in the underlying technical indicators that I track. As you may have predicted, recent market action has triggered my technical indicator for signalling an uncertain strength of the LT trend of the US markets. Therefore, the POS will not trade until conditions improve, even though things are very oversold and we could get a bounce.