Sunday, February 15, 2015

The Last Time this Happened...

For those of us who appreciate technical analysis, I have a chart this week that I find very interesting in its potential implications:


This is a chart of long term treasury bonds charted above the S&P 500 relative to bonds and the S&P 500 itself over the last 20 years. On the chart, I have drawn 20 year trend channel lines and placed vertical lines whenever the price of long term bonds broke above or into the upper channel line. As you can see, every time this happened in the last 20 years, the following has been true:

1) There was much greater risk of a reversal in bond prices for the next few months as prices tended to reverse at the highs of the channel.

2) The S&P 500 began to outperform long term bonds in the next months

3) The S&P 500 also rallied strongly in the months following

4) Two instances were at the bottom of bear market declines in the S&P 500 (2002 & 2009)

5) Two instances were after pullbacks in the S&P 500 during a longer term bull market (1998 & 2012)

So, here we are at another potential turn around in bond prices. The upper channel challenge has yet to decisively complete as bond prices are still elevated versus the trend. However, noting the historical precedent, the risk is high that bond prices do not have further to rise from here.

Coincidentally, we are also seeing breakouts in many global markets coinciding with this moment in bond prices.

From the five observations above, it makes one wonder whether we are about to see a strong bull run in stocks. The common assumption is that money from bonds flows into stocks, so with bond notes selling, stocks may get a boost.

Moreover, with central banks aggressively providing liquidity and bonds on the brink of becoming disfavored, once the upper trend challenge completes, stocks are the likely recipient of future buying.

Now, bonds may not continue to respect the past 20 years of price history and perform differently at this juncture than in the past. Moreover, stocks may outperform bonds, but also sell off. However, looking at historical precedent, I'd say the odds are in favor of the future rhyming with the past. If so, better buckle your seat belt for the bulls about to pump the gas...

Monday, February 2, 2015

Weekly Short Course: 1/26-2/1

Sorry for posting a day late. I update my market models weekly and monitor the trends in their allocation numbers. While I do not follow every market, I follow many important markets via their representative ETFs. There is a list of the current ETFs I am tracking in the sidebar.

 Here is a run through of this weeks observations:

The Basic Model


One of my models is a simple allocation program between the total stock market, VTI, and long term government bonds, TLT. These two ETFs are a great pair to follow since they have almost the same average volatility. Thus, they can be compared based on pure relative strength with about equal expectations for each holdings appreciation or depreciation capability.


The current allocation for this program is Conservative (<40% stocks). This week saw a slight shift back towards bonds.

January was a weak month for US stocks. Traders are abuzz whether we will repeat a 2014 type performance or see more downside. With the number of defensive signs in the market and the technical differences between now and 2014, I am much more concerned about downside risk in US stocks this year. Buyers and sellers are much more in a dead heat this time around as longer term trends go flat.


Checking in on Five Horsemen of US Stock Risk for January


Mentioned a few weeks ago, I spoke on the ETFs I felt represented fear in the global markets, particularly as pertains to the US stock market. As you can see above, all five performed very well in January, reflecting widespread defensiveness to start the year. This is not conclusive evidence for a coming correction or bear market. It is merely an observation highlighting the heightened risk in US stocks currently.

Gold, a Zero Yield Investment?


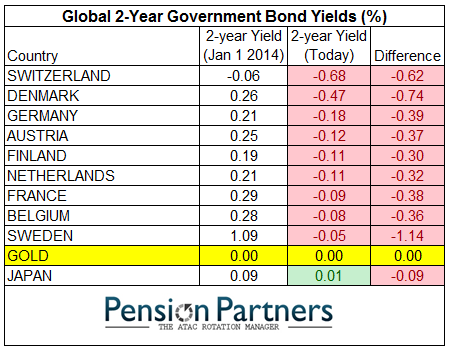
I borrowed the chart below from Pension Partners to show something I am thinking about concerning the recent strength in gold. Gold is a traditionally inflationary asset, being a store of value when national currencies depreciate over time. However, gold has been strong to start the year in the face of both a strong dollar and a highly deflationary environment. 

The strength could be caused by a shear fear trade as the other tail wind to inflation for gold is panic buying. However, many articles are coming out offering another fundamental reason why gold could find strength in an extreme deflationary environment. When bond yields go negative and are expected to continue to drop in the current environment gold can become competitive as an alternative investment to the safety of bonds. Yield is the classic advantage of investing in bonds over gold. Does gold catch a bid when this advantage is practically removed by negative interest rates?
  

Overall


Deflationary assets (bonds, dollar, inverse commodites, gold, defensive stock sectors) continue to lead and black clouds remain over the US stock market. I am still waiting for signs of a real fight in global stocks for the year. Will it come in February?

See you all next week!